Let me tell you about a little online journey I just completed. What started in the realm of entertainment (science fiction and time travel), ended up taking me to some faimiliar areas of visualization with some funny tie-ins, touching on the work of Tufte, and introducing me to a new web comic in the process.
Let me begin by saying that time perception is one of my research interests. My master’s thesis was on time perception in virtual environments, looking at elements that make time seem to pass more quickly/slowly. This being the case, I’m also interested in how time is described and perceived in various works of fiction. So, it shouldn’t be a suprise that one of my favorite television shows is Doctor Who, a british series revolving around characters who have adventures traveling through time and space. So, while youtubing various clips from the show, I came across a vid that referenced this Metacritic Article on the Best and Worst Time Travel Movies of all time. I checked out the list and recognized most of the movies, but number 15 on the “best” list was a film titled Primer that I’d never heard of. After doing a little research, I found that Primer was a 2004 independent film that had a $7,000 budget and won some awards at the Sundance Film Festival. I was intrigued, and decided I needed to watch the movie (available for purchase from the Primer website).
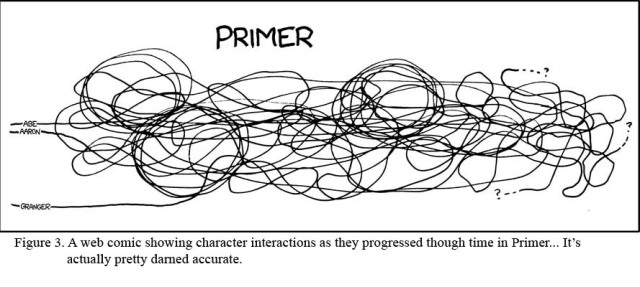
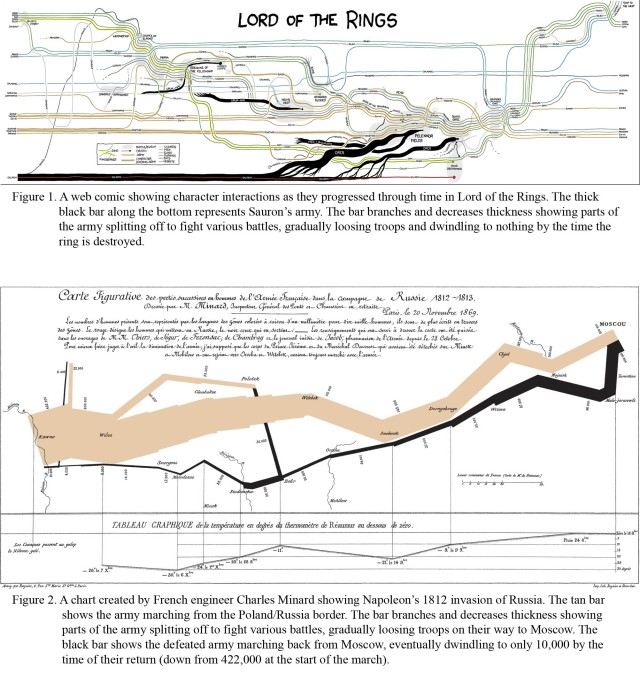
I don’t wish to turn this post into a movie review, but let me just say that I enjoyed Primer immensely. I really liked how it depicted the process of innovation, showing some guys trying to develop and improve an existing technology, finding some unexpected side-effects of their work, and eventually abandoning their original idea to develop those side-effects into a new technology. Positive comments aside, Primer is definately one of those movies where you need to watch it more than once to really understand what’s going on. I found myself going to the movie’s forum to see if anyone could shed some light on parts of the movie that flew over my head. It was here that somebody referenced this xkcd comic that shows a graph of character interactions through time in several movies. In addition to Primer, the comic also showed charts for Lord of the Rings, Star Wars, Jurassic Park, and 12 Angry Men. It was the chart for Lord of the Rings, that really caught my attention. Figure 1 below shows Sauron’s Army, while Figure 2 shows Napoleon’s army.
While these two charts depict differ in some respects, there are unmistakeable similarities. Both are able to merge and display multiple types of data in a coherent manner (army size, time, geographic location…). I find it simultaeously both great and hilarious that essentially the same visualization that Edward Tufte called “Probably the best statistical graphic ever drawn” is being used in a web comic.
…and in case you’re interested enough to see the movie that brought me this point, [spoiler alert] see Figure 3. 
…and to wrap things up, let me ask you internet, what are your thoughts on all of this? Are there any important time travel movies missing from the list? Should I be suprised to find renowned visualization practices finding their way into comics? Are there other good examples of informative visualization being used in entertainment? If you know of any good ones (or very poor ones on the opposite end of the spectrum), or if you have any other thoughts, please post them in a response.


I’ve been curious about this post since I saw your tweet about it, but only got around to reading it now. It didn’t disappoint 🙂 I was really wondering how you brought all these things together! Interesting and entertaining post, and good job ending it with a question, to encourage comments!
So, what do you think about infographics? They seem to be (some of them) good visualizations used for entertainment. Oh, and check out GraphJam, not necessarily great visualizations, but certainly entertaining! http://graphjam.memebase.com/
Crazy stuff. Just wanted to mention that every army that has ever attempted to invade Russia has failed… as far as I know. It’s just too big (TWSS).
Anyone that can help with time/visualization attacks that end up to your face?
*definitely
Nothing like an old post that drags up new responses, eh? 🙂 I appreciate this little agglomeration of visualizations about time. Going straight into my bookmarks. Thanks!